How to track and compare liquidity pool positions
To compare liquidity pool positions, use relative metrics (percentage return, annualized APR and pool vs hold) instead of absolute dollar amounts. The position that earned the most fees may have been the worst in your portfolio if it used far more capital or spent a long time out of range.
What to track in each liquidity position
- Identification: protocol, network, pair, fee tier and position ID (in concentrated liquidity, the NFT number).
- Capital: how much was deposited, including every deposit and withdrawal.
- Current value: what the position is worth now.
- Earnings: pending fees, collected fees and rewards, such as AERO.
- Range: whether the position is in or out of range.
- Performance: ROI, APR and pool vs hold.
Example: the best-earning position isn't always the biggest
Two positions in the same wallet:
- Position A: $20,000 in capital, $800 in fees over 60 days.
- Position B: $2,000 in capital, $150 in fees over 30 days.
By dollar value, A looks much better. Now annualize the earnings relative to capital:
- A: 800 ÷ 20,000 × 365 ÷ 60 ≈ 24% per year
- B: 150 ÷ 2,000 × 365 ÷ 30 ≈ 91% per year
Per dollar invested, B earned almost four times as much. Even so, before moving capital from A to B, check the pool vs hold for both: a high APR may come from a very volatile pair with greater Impermanent Loss.
Position yield vs. pool yield
Another useful comparison is between your position and the pool itself. The pool's daily yield is the ratio of the last 24 hours of fees to total liquidity (fees ÷ TVL). Your position's yield is the same calculation using your capital (your fees ÷ position capital). In the Tracker, we call this ratio fee velocity.
Example: the pool yields 0.03% per day and your position yields 0.12% per day. Your capital is earning 4 times the pool average, a sign that your concentrated range is well placed. If your position earns below the pool average, your range is probably too wide or the position has spent time out of range.
Benchmark: compare against the alternatives
Making money doesn't mean your capital was put to good use. In finance, the way to find out is a benchmark: comparing your result with what the same capital would have done elsewhere. In liquidity, the most common alternatives are:
- Holding the tokens (pool vs hold)
- The pool's own average
- The same pair at another fee tier or on another DEX
- Other pools over the same market period
A position earning 20% a year looks great, until you see that the same pool, in a different range, paid 40% over the same period.
Compare positions in context
- Same period: compare annualized rates, never the totals of positions of different ages.
- Same type of risk: a stablecoin pair and a volatile pair don't carry the same risk, even with a similar APR.
- Same model: concentrated liquidity (Uniswap V3/V4, Aerodrome Slipstream) and traditional pools (Aerodrome Basic) have different efficiency and risks.
- Full yield: in staked positions on Aerodrome, AERO adds to the fees; without it, the position looks like it earns less than it really does.
Open and closed positions
Your portfolio's performance isn't just what's open today. Closed positions, whether profitable or not, are part of your history and show which strategies worked. People who only look at open positions tend to forget the ones that went wrong and overestimate their own performance.
Why centralize your tracking
Each DEX shows its own positions, using its own criteria. With multiple wallets, networks and protocols, comparing them means bringing everything into one place, with the same methodology for every position.
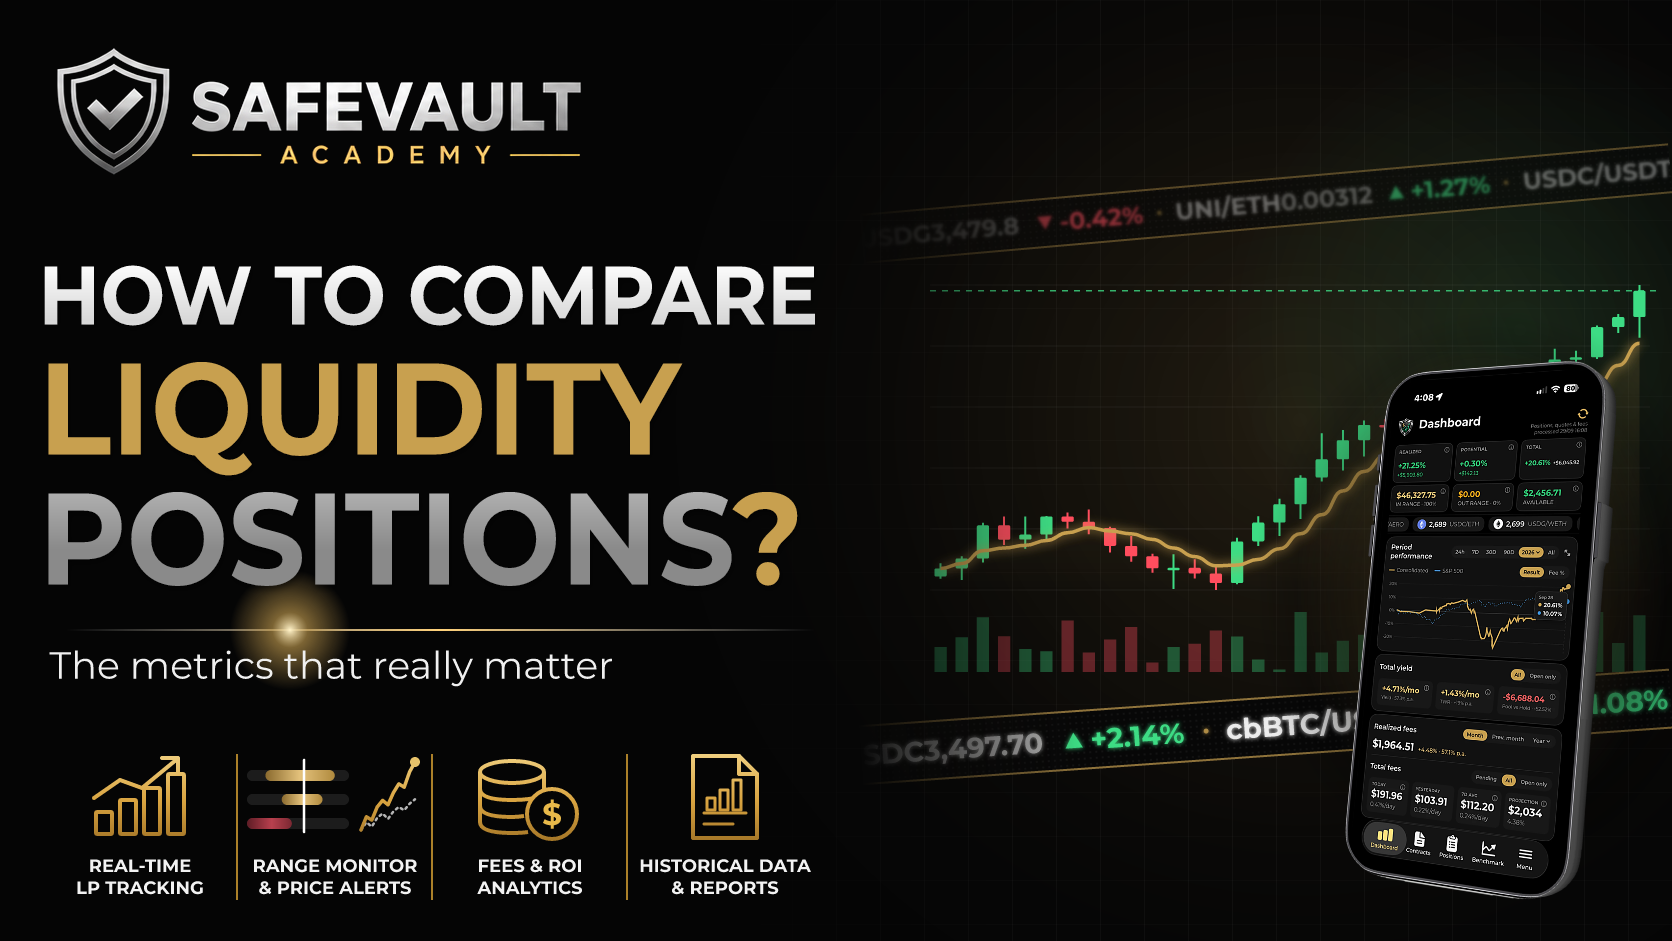
The SafeVault Performance Tracker does exactly that: it brings together open and closed Uniswap and Aerodrome positions from multiple wallets, compares them all using the same metrics and, in Pool Benchmark, puts each one side by side with other pools on the market.
Frequently asked questions
How often should I review my positions?
Concentrated positions with a narrow range need daily attention or alerts; traditional pools and wide ranges can be reviewed weekly.
Which metric should I use to choose between two pools?
Start with the annualized APR and confirm it with pool vs hold. One without the other gives you an incomplete picture.
Is it worth tracking small positions?
Yes. They're often tests of new strategies, and their results help you decide where to put more capital.
Conclusion
Tracking an LP portfolio isn't just about knowing how much money is in each pool. It's about comparing each position's performance using the same metrics, over the same period and with the full yield.
With a well-organized history of open and closed positions, it becomes clear where your capital is working best, and where it's just taking up space.